|
-- for the Week Commencing 26th May 2003, 2nd Page
Gold and
the Dollar
The 1970s Roadmap
We would never make an investment/trading
decision solely on the basis that a market appeared to be following a similar
path to one that it had followed during some past time. This is because
there are always a lot of differences between the present and the past.
However, patterns do tend to repeat themselves and we can certainly learn
from what happened in the past. Also, we've found that it helps to have
a rough roadmap in mind for the markets we are trading and to then continuously
check the current price action against our roadmap (that is, against our
expectations) to make sure we are on the right track.
Recently we've considered two possible
scenarios for gold stocks, with one of these scenarios being that gold
stocks will continue to follow a similar path to the one they followed
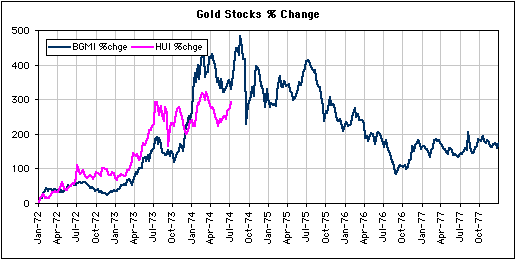
during the bull market of the early 1970s. The below chart, which overlays
the percentage change in the HUI since its November-2000 bottom onto a
chart showing the percentage change in the Barrons Gold Mining Index since
its January-1972 bottom, indicates that the correlation between 'then'
and 'now' remains high. If this high correlation persists then the HUI
will surge to a very important peak over the next 2 months, after which
there will be a substantial and lengthy downturn.
Now, let's take a look at charts showing
how gold and the US$ performed during the 1972-1977 period (the same period
covered by the above chart). Note that in the second of the below two charts
the line on the chart rises when the US$ is strengthening against the Swiss
Franc.

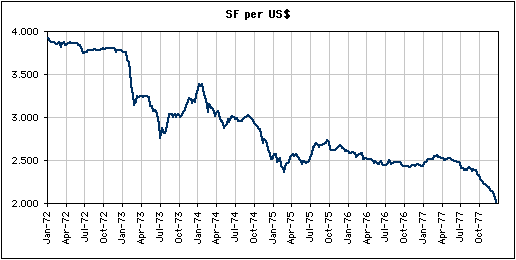
The above charts show that:
a) Gold stocks peaked in August of
1974 and then trended lower for 2 years before commencing the next phase
of their secular bull market.
b) The gold price peaked in December
of 1974 and then trended lower for about 20 months before resuming its
advance.
c) The US$ bottomed in February of
1975 and then moved sideways for about 2 years before resuming its decline.
That is, gold stocks peaked about 4
months in advance of a peak in the gold price and the gold price
peaked about 2 months in advance of a bottom in the US$. It therefore
wasn't possible, during 1974, to successfully trade gold and gold stocks
by reacting to what was happening to the US$. Anticipation was required
because gold stocks and gold began to discount a trend reversal in the
US$ months before the reversal actually happened.
Interestingly, gold and gold stocks
have tended to lead the currency market over the past few years just as
they did during the first half of the 1970s. We therefore think it is reasonable
to assume that gold-stocks and gold will lead the next major trend
reversal in the US$. In other words, the current action of the gold price
is likely to tell us a lot more about the future value of the US$ than
the current action of the US$ tells us about the future price of gold.
There are two logical places for the
US Dollar Index to bottom this year, one being in the 90-92 range (just
below the current level) and the other being near the 1995 low (around
80). If the market expects the US$ to bottom in the 90-92 range then gold
stocks will probably NOT surge to a major peak over the next 2 months.
However, if the market begins to suspect that support in the 90-92 range
will not hold and that much lower levels are likely for the US$ over the
coming several months then the prices of gold and gold stocks should soon
rocket higher. In other words, if the gold sector is to continue along
a similar path to the one followed by gold stocks during the early 1970s
then the market must soon start to believe that the US$ is going to drop
well below 90 over the coming months. Such a decline in the US$ would,
in turn, almost certainly lead to a bottom from which a 1-2 year rally,
or at least a 1-2 year stabilisation, in the dollar's exchange value would
occur.
If, on the other hand, support at 90-92
is going to hold then we are already close to a US$ bottom. Such a bottom,
though, would probably only lead to a 3-6 month dollar rally or dollar
stabilisation. This is essentially what we've referred to as scenario 'b'
in recent commentaries (under this scenario gold stocks would pullback
for a few months before embarking on a major advance).
Hopefully, the above explains how a
1974-type major peak and subsequent 1-2 year decline in gold stocks is
possible. If we are going to get a major bottom in the US$ later this year
then a huge surge in gold and gold stocks is likely over the next 2 months.
However, if it is anticipated that the dollar is going to bottom near current
levels then we would not get a surge in gold and gold stocks in the short-term,
but neither would we likely get a pullback lasting more than a few months.
In summary, it all depends on how much of a dollar decline the market decides
to discount.
Newmont and Gold
Newmont Mining (NEM) is now almost
completely unhedged. The company has strong management, is the world's
largest gold miner in terms of reserves and annual sales, has a geographically-diverse
portfolio of gold mining assets, and is not unduly affected by large changes
in exchange rates (except to the extent that those changes impact the US$
gold price). Furthermore, the NEM stock is fairly valued at its current
level based on a gold price of around $370. These characteristics mean
that NEM is probably a better proxy for the overall gold sector than any
of the popular gold-stock indices (including the Schultz Gold Index).
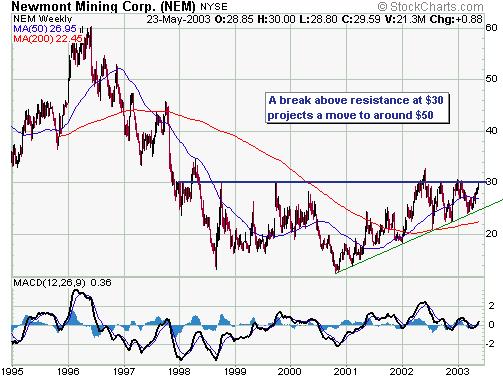
The below weekly chart of the NEM stock
price shows the base that has been more than 5 years in the making, the
importance of resistance at $30-$31, and just how close NEM is to achieving
a major breakout. Further to the above discussion, a decisive break above
$30 by NEM would have huge implications for the entire gold sector.
We exited an NEM call option position
a couple of weeks ago and wouldn't be interested in re-establishing a trading
position in NEM options with the stock so close to a potential stumbling
block at $30. However, we would probably buy the first pullback after a
break above $30 and we would certainly buy (with great enthusiasm) if the
stock price drops to around $26 over the next few weeks. In the short-term
a pullback is just as likely as an upside breakout.
Below is a chart of the NEM/gold ratio.
NEM is a leveraged play on the gold price so it is not surprising that
the NEM/gold ratio tends to move in the same direction as the NEM stock
price. This chart shows the consolidation that has been underway since
May-2002. It also shows that the major 1996 peak in the NEM stock price
corresponded with an NEM/gold ratio of about 0.15 and that peaks over the
past 5 years have tended to occur when the NEM/gold ratio has moved up
to around 0.10. With a gold price of $410 a ratio of 0.10 would imply an
NEM stock price of $41.

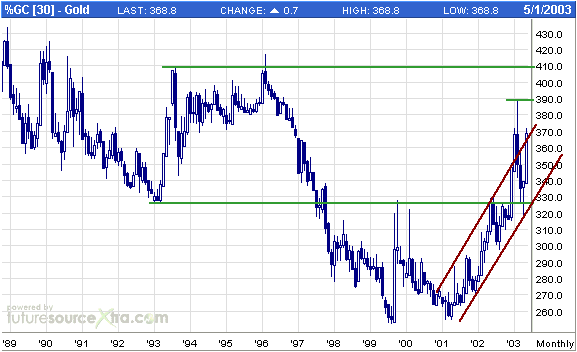
Why did we choose $410 in the above
paragraph? Because once gold broke above resistance at $360 it put in place
two likely targets over the next few months, the first being this year's
peak of $390 and the second being $410 (see monthly gold chart below).
Actually, once NEM breaks above $30
it will be on its way to $50, but it should make it to $41 before the first
sizeable correction occurs (note that $41 would also be the rough target
created by an upside breakout from the contracting triangle that has been
forming since May 2002).
Current Market Situation
The Amex Gold BUGS Index (HUI) broke
above resistance at 140 last week, but the performance of gold stocks relative
to the gold price continues to be uninspiring. It seems that it is going
to take a move by the gold price to above its February high ($390) to generate
some speculative enthusiasm for the gold stocks.
When the gold price rocketed higher
in January and February this year the popular explanation was that the
gold market was reacting to the war tensions. Our view, at the time, was
that the war was actually a 'negative' as far as the gold market was concerned
because it was distracting investors from the real reason for gold rally
(the real reason was, and is, US$ weakness). If gold can now move above
$390 it will prove that the war was not the reason for the previous strength
and provide an air of sustainability that should certainly boost many of
our gold stocks. We think this will be the case even if the gold price
moves only $10-$20 above the February peak.
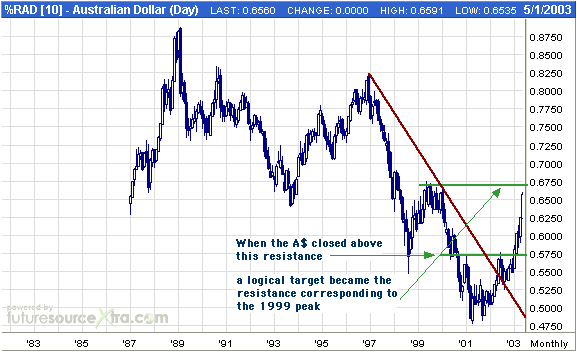
The risk to gold and gold stocks in
the short-term is that the US$ might be close to an intermediate-term bottom.
The Dollar Index is within spitting distance of its 1998 low, the euro
has just nudged above its 1999 high, the Swiss Franc has reached its 1998
peak and the A$ (see monthly chart below) is very close to reaching the
67c target we first mentioned late last year. As such and even though there
aren't yet any signs that the dollar has bottomed, now is certainly not
a great time to be getting bearish on the US$ and bullish on other major
currencies.
Update
on Stock Selections
Reserved for subscribers
Chart Sources
Charts appearing in today's commentary
are courtesy of:
http://stockcharts.com/index.html
http://www.futuresource.com/

|

