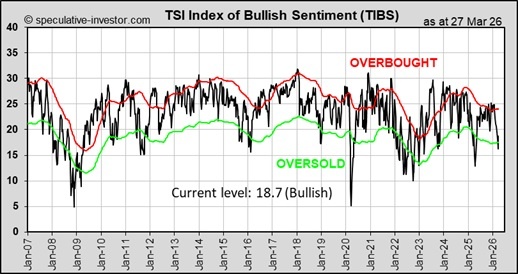
| US Stock Market Sentiment Indicator |
| TSI Index of Bullish Sentiment (TIBS) – updated weekly TIBS is a medium-term stock market indicator. It is an amalgamation of six different sentiment indicators: the Investors Intelligence and AAII sentiment surveys, the NAAIM Exposure Index, the CNN Fear and Greed Index, the 5-day MA of the VIX and the 5-day MA of the Equity Put/Call Ratio. |
 |
| Gold and Stock Market Fundamental Indicators |
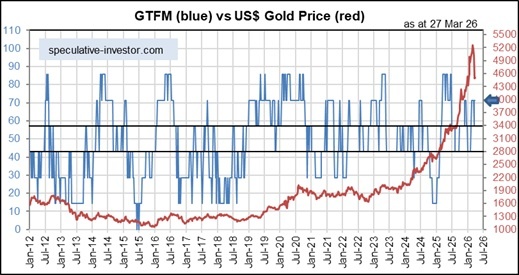
| The Gold True Fundamentals Model (GTFM) – updated weekly The GTFM takes into account the seven most important fundamental drivers of the US$ gold price (the real interest rate, the yield curve, credit spreads, the relative strength of the banking sector, the strength of growth stocks relative to defensive stocks (an indicator of whether the financial world is tilting towards growth or safety), the general trend in commodity prices and the bond/dollar ratio) to arrive at a number between 0 and 100 that indicates the extent to which the fundamental backdrop is gold-bullish. 100 signifies maximum bullishness and 0 signifies minimum bullishness (maximum bearishness). |
 |
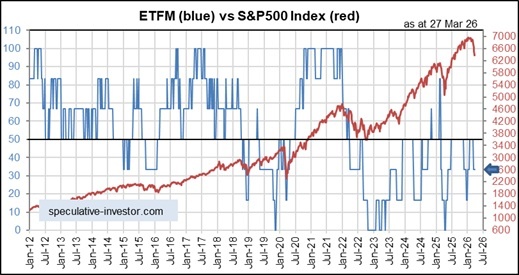
| The Equity True Fundamentals Model (ETFM) – updated weekly The inputs to the ETFM are the six most important fundamental drivers of US equity prices (as represented by the S&P500 Index). These drivers are the monetary inflation rate as determined using our “G2 TMS” calculation (refer to Global Monetary Indicators below), the real interest rate, the yield curve, credit spreads, the level of US economic activity as indicated by the ISM New Orders Index (NOI) and the performance of growth stocks versus defensive stocks. The output of the ETFM is a number between 0 and 100 that indicates the extent to which the fundamental backdrop is bullish for the stock market. 100 signifies maximum bullishness and 0 signifies minimum bullishness (maximum bearishness). |
 |
| Global Monetary Indicators |
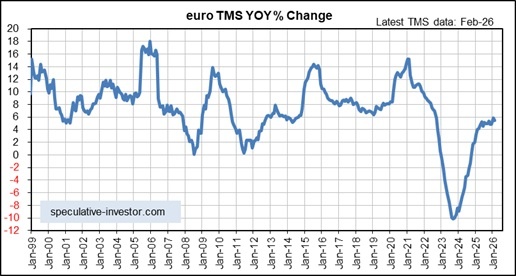
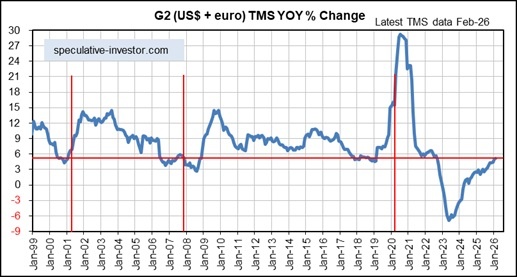
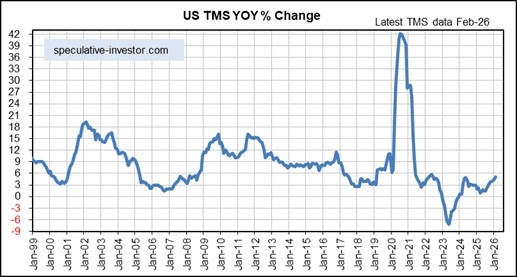
| Money Supply Growth – updated monthly TMS (True Money Supply) is the most accurate monetary aggregate. Whereas popular measures such as M2 and M3 contain credit instruments, TMS only comprises money. Specifically, TMS comprises currency, checkable deposits and savings deposits. The first of the below charts shows the year-over-year TMS growth rate (the monetary inflation rate) in the US and the second of the charts shows the monetary inflation rate in the euro-zone. The third chart shows the annual rate of change in a monetary aggregate that we call “G2 TMS”, which combines the US and euro-zone money supplies. The rate of change in the G2 TMS growth rate has been the most useful leading indicator of the global boom-bust cycle over the past two decades. Of particular significance, a decline in the G2 TMS growth rate from well above 5% to below 5% warns of a shift from boom to bust within 12 months. Note that the vertical red lines on the G2 TMS chart indicate the official starting times for US recessions. |
|
| US Economic Indicators |
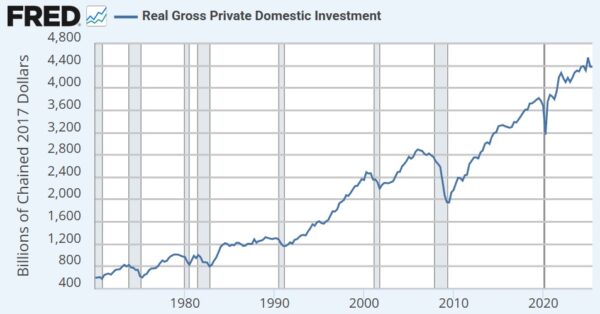
| Real Gross Private Domestic Investment (RGPDI) – updated quarterly RGPDI is our favourite long-term leading indicator of US recession. It has never generated a false recession signal, but its lead time can be up to two years and it only gets reported quarterly. The shaded areas on the following chart mark the official recession periods for the US economy. |
 |
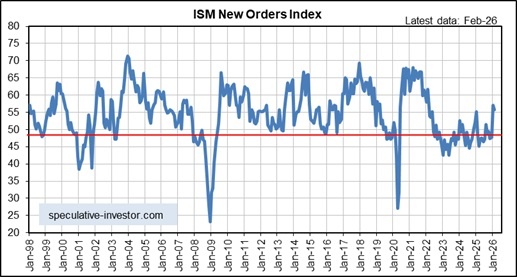
| The ISM Manufacturing New Orders Index (NOI) – updated monthly As a leading indicator of US recession the ISM Manufacturing NOI is not quite as reliable as RGPDI, but it has the advantage of being reported in a more timely fashion (the NOI for a month is reported near the beginning of the next month). The NOI warns that a recession is about to begin when it moves below 48. |
 |
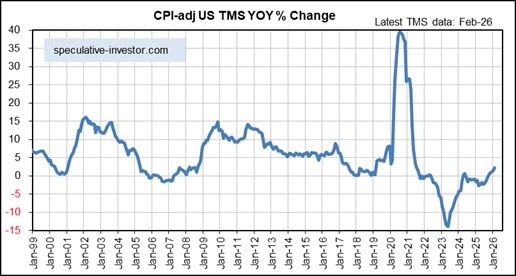
| The CPI-Adjusted TMS Growth Rate – updated monthly The CPI-adjusted year-over-year TMS growth rate (the US TMS growth rate minus the annual rate of change in the “Median CPI” reported by the Cleveland Fed) is a leading economic indicator with a lead time of 6-18 months. |
 |
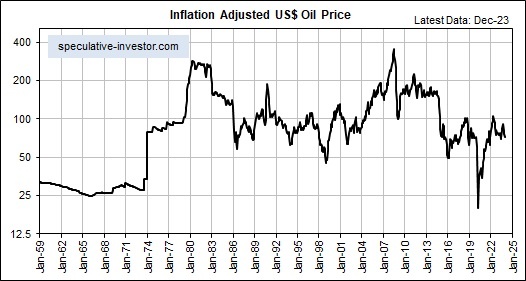
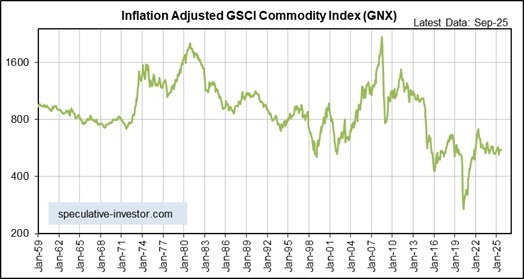
| ‘Real’ Performance Indicators |
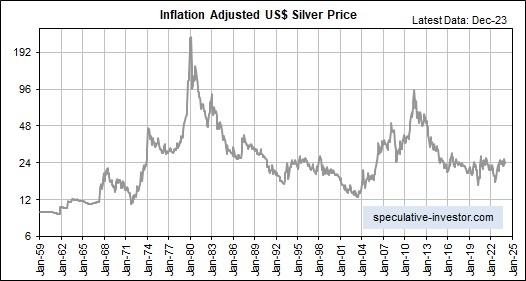
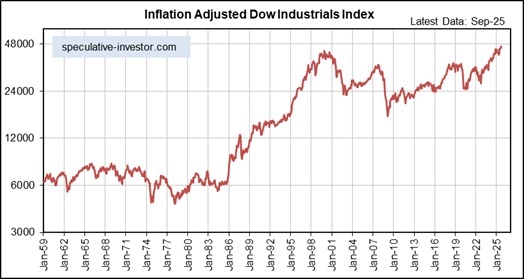
| Inflation-Adjusted US$ Prices – updated monthly The following monthly charts show the inflation-adjusted (IA) performances (in current US dollars) of gold, silver, the Dow Industrials Index, oil, and the Goldman Sachs Spot Commodity Index (GNX) since 1959. In these charts we use a method of adjusting for the effects of US$ inflation that was first outlined in a 2010 article. This method isn’t reliable over periods of 2 years or less, but it should come close to reflecting reality over the long term. |
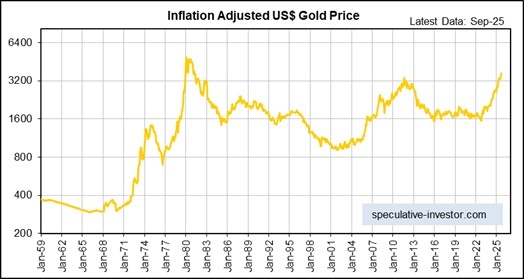
|