-- 2007 Forecast
The following forecasts were included in the 24th January 2007 Interim Update and the 29th January 2007 Weekly Market Update.
Yearly
Forecast
 Introduction Introduction
This is the time of
the year when it is traditional for market commentators to pen their
annual forecasts. We always follow this tradition and have included,
below, our 2007 forecasts for the US dollar, bonds, commodities, gold, and the US stock market.
When reading these or anyone else's forecasts you should keep in mind,
though, that successful investing/speculating is about being able to
manage money and do real-time analyses of risk versus reward; it is not
about being able to accurately forecast.
A theme that runs through our various market outlooks for the coming
year is that there will be a significant slowdown in global economic
growth during the second and third quarters. A significant growth
slowdown seems like a reasonable expectation given that:
a) Credit spreads are near all-time lows and are therefore more likely to increase than decrease.
b) Profit margins are near all-time highs and are therefore likely to contract.
c) Inflation expectations are presently near their lows of the past
three years, which is the optimum place for them to be because a
further reduction would require a deflation scare while an increase
would put downward pressure on stock and bond valuations. That is, any
change from here -- and some form of change is likely -- will move
inflation expectations away from their optimum level.
d) The inverted yield curves in the US and elsewhere indicate that
liquidity growth is still strong, but they also indicate that the
liquidity trend is very mature and vulnerable to a reversal.
e) The popular view seems to be that the downturn in the US housing
market has run its course, but the historical record points to a high
risk of this view being overly optimistic.
In other words, right now things appear to be as good as they are going
to get, and when things can't get any better there's a good chance they
will get worse. As discussed in many previous commentaries, an upward
reversal in the US yield-spread should prove to be one of the clearest
signals that things are about to get worse.
 The US Dollar The US Dollar
The Current Account Diversion
Before we get to our US$ forecast we thought we'd weigh-in on a debate between Peter Schiff and Robert Murphy
regarding the implications of the US's large and seemingly
ever-expanding current account deficit (and corresponding capital
account surplus since a deficit on the current account must be offset
by an equivalent surplus on the capital account). Mr Schiff argues that
the current account deficit is a major problem that virtually
guarantees a much lower US$, whereas Mr Murphy argues that today's
balance of payments situation is not necessarily a bad thing and does
not point towards a weaker US$.
On this topic our views are much closer to those of Mr Murphy than
those of Mr Schiff. A large current account deficit does not, in and of
itself, constitute a problem. The fact is that it can be advantageous
for some countries to run current account deficits and, at the same
time, advantageous for other countries to run current account
surpluses, just as it can be advantageous for two individuals to engage
in a transaction whereby one individual provides goods or services to
the other in exchange for the promise of a future return (an IOU or a
stake in a business venture, for instance). Actually, the simplest way
to see that neither a current account deficit nor a current account
surplus is necessarily problematical is to reduce the issue to the
individual level. After all, no country decides to run a current
account deficit or surplus; rather, the balance of payments situation
for any country is the net result of millions upon millions of
individual transactions.
To make the point that neither a deficit nor a surplus on the current
account is necessarily a bad thing Mr Murphy describes the hypothetical
example of an American entrepreneur who can't afford to purchase the
office equipment (computers, photocopiers, phone system, etc.) needed
to get a new business off the ground. In exchange for a stake in the
business, some Japanese investors send the American entrepreneur the
required office equipment thus allowing him to begin the wealth
creation process. If the business succeeds then both parties to the
transaction -- the American entrepreneur and his Japanese investors --
will benefit. The US economy as a whole also stands to benefit despite
the fact that the transaction adds to America's current account
deficit.
Further to the above and as we've noted many times in previous
commentaries, the US current account deficit is not a good reason, in
itself, to be bearish on the US dollar. A large current account deficit
can sometimes, however, be symptomatic of an inflation (money-supply
growth) problem in that a relatively high inflation rate in a country
will lead to a relatively large rise in the costs of doing business
within that country, thus increasing the incentive to import goods
rather than manufacture them locally. And a relatively high inflation
rate IS a very good reason to be long-term bearish on a currency. In
fact, a relatively high inflation rate is the ONLY good reason to be
long-term bearish on a currency.
In general terms, what happens is that if the supply of Currency A
consistently grows at a faster rate than the supply of Currency B then
Currency A will end up losing its purchasing power at a quicker rate
than Currency B; and if this happens then the A/B exchange rate will
trend lower over the long-term. Under such circumstances Country A will
most likely end up running a greater current account deficit than would
otherwise have been the case, but it's critically important to realise
that the problem lies in the inflation, not in the current account.
Which leads us to the question: Has the large US current account deficit stemmed from a relatively high US inflation rate?
We think the answer is yes; inflation has, over the past several years,
been an important contributor to the widening of America's current
account deficit. There are two reasons for thinking this way. First,
the supply of US dollars increased at a relatively high rate during
1998-2002 and this inflation, like all inflations, undoubtedly resulted
in misdirected investment and higher costs. Second, a substantial
portion of the external demand for US dollars over the past 5 years has
come from foreign central banks.
Expanding on the second of the aforementioned reasons, it seems that
over the past 5 years private foreign investors, as a group, have not
been overly impressed by the potential real investment returns on offer
in the US. As a result, foreign central banks -- institutions that
often have as their primary motivation something other than achieving a
reasonable real return on investment -- have had to 'take up the
slack'. As opposed to being comprised almost entirely of transactions
of a similar nature to the one in the above-described hypothetical
example, over the past 5 years a big chunk of the foreign investment
demand for US dollars has been associated with the currency-management
programs of foreign central banks. Specifically, foreign central banks
have bought-up huge quantities of US dollars and funneled these dollars
into the US bond market with the primary goal of preventing their own
currencies from appreciating. Such dollar-support operations would
never have been necessary had the large current account deficit not
been an effect of rampant US$ inflation.
But that was then and this is now. Over the most recent 3-year period
the US dollar's inflation rate has generally been lower than the
inflation rates of its major fiat currency counterparts. Therefore,
whereas it was an obvious choice for us to be long-term bearish on the
Dollar Index back in 2000-2004, it is no longer a cinch that the US
dollar's foreign exchange value will ultimately trade at much lower
levels. This is not because the US dollar's fundamentals have improved,
but because other currencies' fundamentals have worsened. (As an aside,
the rapid simultaneous devaluation of all fiat currencies via inflation
improves the long-term investment case for gold. Gold will eventually
become widely recognised for what it already is: the only viable
alternative to the dollar.)
In conclusion, the US$ bears whose bearish outlooks are primarily based
on the current account deficit might end up being right about the
dollar, but if so they will be right for the wrong reason.
Specifically, they will only be right if the US$ inflation rate once
again becomes relatively high. On the other hand, making a long-term
bet against the US$ via currencies such as the euro, the British Pound
and the Canadian Dollar -- a tactic that worked very well during
2002-2004 -- will result in losses if the relative inflation-rate
trends of the past three years continue.
2007 Forecast
Interest rate differentials and inflation expectations are the most
important determinants of intermediate-term currency market trends.
Although the US dollar's interest rate advantage has diminished over
the past 6 months, an advantage still exists. Furthermore, changes in
interest rate differentials tend to affect currency exchange rates with
a lag of at least 2 quarters, so even if the dollar's interest rate
advantage were to completely disappear by the middle of this year the
interest rate backdrop would probably remain supportive for the dollar
through to year-end.
Inflation expectations are always a wildcard in that they can change
quickly and unpredictably. For example, when New Orleans was devastated
by Hurricane Katrina the expected rate of dollar depreciation increased
due to the surge in US government spending that was expected to result
from the massive re-building effort.
As things currently stand, the differences between the yields on
inflation-protected and non-inflation-protected securities tell us that
inflation expectations are near their lows of the past three years.
This means that in the absence of a deflationary shock, inflation
expectations are more likely to rise than fall over the next few
months. Rising inflation expectations usually result in downward
pressure on the dollar.
Our expectation is that 2007 will be a good year for the Dollar Index,
but if inflation expectations rise over the next few months in parallel
with rebounds in commodity prices then most of the dollar's gains will
probably occur during the second half.
 Bonds Bonds
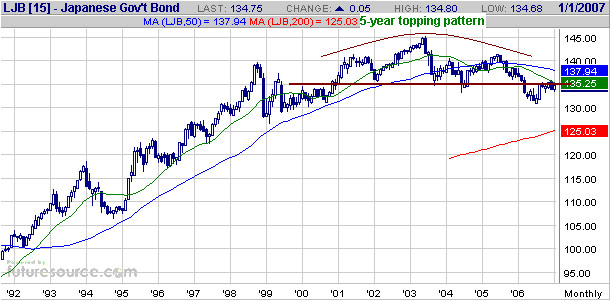
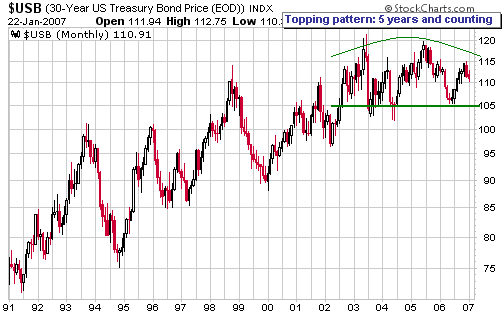
Our view is that bonds are in the process of completing a major topping
pattern. However, although such a pattern is readily apparent in the
first of the following charts (a long-term monthly chart of Japanese
Government Bond futures), the second of the following charts (a
long-term monthly chart of US T-Bond futures) is more ambiguous. We
interpret everything that's happened in the US bond market over the
past 5 years as a topping process with the ultimate top having been put
in place in June of 2003, but more bullish interpretations will retain
some plausibility until the bond price breaks decisively below its
August-2003 and May-2004 lows.
We suspect that the
T-Bond's price action remains ambiguous due to the massive demand for
bonds stemming from foreign central banks. During 2003-2004 the bulk of
this demand came from the central banks of China and Japan, but over
the past two years the central banks of the world's major oil-producing
countries have taken the lead thanks to the huge quantities of
oil-related dollars that have flowed into their coffers. What we find
interesting, as well as encouraging as far as our long-term bearish
view on bonds is concerned, is that the hundreds of billions of dollars
of additional central-bank-generated demand for US debt securities over
the past three years has only managed to prevent bonds from
breaking-out to the downside. In other words, the huge additional
demand from the official sector has enabled bonds to do no better than
'tread water'.
We remain long-term bearish on bonds due to our expectation that the
weaknesses inherent in today's monetary system will become more widely
recognised over the coming years, but are "neutral" as far as this year
is concerned. We are anticipating a slowdown in global growth, weakness
in stock markets and additional weakness in industrial commodities
during the second and third quarters of this year, a backdrop that
would likely create a bid for high quality bonds such as 30-year US
Treasuries. However, such a backdrop would also be likely to prompt the
world's major central banks to abandon any inflation fighting pretense
and begin overtly promoting inflation, thus setting the stage for a far
more bond-bearish backdrop during 2008 and beyond.
Our 2007 forecast, therefore, is that high-quality government bonds
will make their lows during the first 5 months of the year and then
rally enough to end the year roughly flat. Lower-quality (higher-risk)
bonds are, however, expected to perform very poorly during 2007; in
other words, we expect credit spreads to widen (we expect that yields
on low-quality bonds will rise relative to yields on high-quality
bonds). This, in turn, should coincide with strength in gold relative
to industrial metals.
 Commodities Commodities
Oil
Our view is that oil commenced a cyclical bear market (a 1-2 year
downward trend within the context of a secular bull market) last July.
We expect that this cyclical bear market will bottom in the $40-$50
range some time this year.
We aren't believers in the theory that the world is going to experience
an oil shortage within the foreseeable future, but there is clearly a
lot of evidence to support the idea that there is an emerging shortage
in low-cost conventional oil. A much higher oil price is therefore
necessary to make the huge reserves of high-cost non-conventional oil
-- first and foremost, the oil contained within Canada's vast tar sands
-- economically feasible.
We don't think there's much chance of oil making a sustained move below
$40 ever again, not just because of the emerging shortage of low-cost
conventional oil but also because of currency depreciation. However, if
there's a substantial slowing of global growth during 2007 then
long-term support in the low-$40s will probably be tested.
If there is not a significant slowing of global growth during 2007 then
the oil price probably won't move far below the low reached earlier
this month.
Our forecast is that in the absence of a major Mid-East-related supply
shock the oil market will be uninteresting during 2007, with the oil
price spending 90% of its time between $45 and $65.
Natural Gas
Our view has been that the natural gas (NG) market would test its
September-2006 continuous contract bottom ($4) during the first two
months of 2007, following which a major upward trend would begin. As
previously noted, we would consider a drop to the low-to-mid $5 area to
constitute such a test.
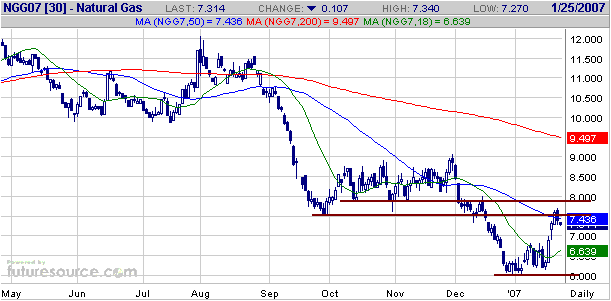
As illustrated by the first of the following charts, the February NG
futures contract has rebounded strongly over the past week. However,
unless it is able to achieve a daily close above $8 we will assume that
the aforementioned test of the September-2006 bottom is still on the
cards.
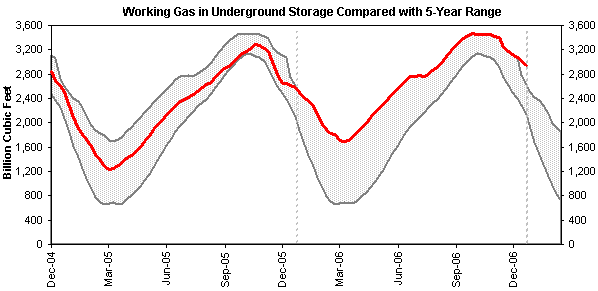
A test of the low still appears to be the most likely bet because: a)
as evidenced by the second of the following charts, the amount of NG in
storage remains much higher than normal for this time of year, b) the
NG market has followed its seasonal/cyclical pattern very closely over
the past year and this pattern projects a January-February -- more
likely now to be February -- test of the September low, and c) the NG
price has just reversed lower from a confluence of resistance in the
$7.50-$8.00 range.
We expect NG to trend
higher from whatever low it makes during the first 2 months of the
year, but a move up to near the 2005 high probably won't occur until at
least 2008.
Industrial Metals
The copper market led a sharp sell-off in the industrial metals during
December and the first half of January, but prices within the sector
have recently firmed-up and a couple of metals (nickel and tin) have
even moved to new all-time highs.
Due to the large divergences in the price performances of different
industrial metals over the past several months it is difficult to come
up with a sector-wide outlook. However, when there's a disparity
between what's happening in the copper market and what's happening in
markets for the more thinly traded metals we will generally go with the
copper market. We therefore take the breakdown in the copper price as
evidence that a major peak was put in place last May.
Our 2007 forecast is that industrial metals prices will be stable or
firm during the first few months of the year and weak during the
remainder of the year in parallel with a global growth slowdown.
Grains
Our outlook for grain prices was discussed in the 15th January Weekly Market Update, at which time we said:
"...the cyclical advance in the grain markets that began in early 2005 is very much intact..."
and:
"...we can look forward
to a continuation of the massive ethanol subsidies and all their
adverse ramifications [including upward pressure on grain prices].
Furthermore, there is a chance that later this year the increased
demand for gains stemming from the burgeoning ethanol industry could
meet a supply disruption caused by El Nino."
As far as the coming 12 months are concerned we think the grain sector
has the most upside potential and, with the possible exception of gold,
the best risk/reward ratio in the commodity universe.
 Gold Gold
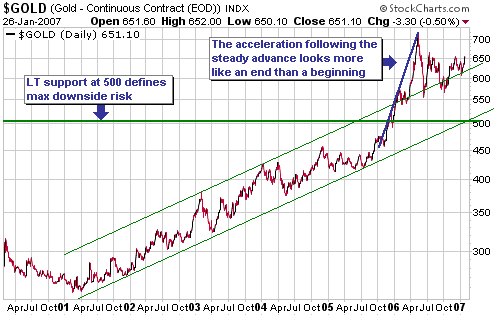
The chart of the US$ gold price included below shows that gold trended
higher at a steady pace from the first quarter of 2001 through to the
third quarter of 2005, and then accelerated upward to a peak in May of
2006. Upward acceleration of this nature is something that usually only
happens during the final phase of a multi-year rally and in this case
it might have ushered-in a correction that will last 1-2 years. The
first of our two most probable scenarios, therefore, is that the
correction that began in May of 2006 will continue until at least the
final quarter of this year. The next multi-year advance in the gold
price would then get underway.
Given that the short-term (1-3 month) outlook for gold is bullish, this
first scenario would likely involve a test of the May-2006 peak at some
point during the first few months of the year followed by a drop to
re-test the June-2006 bottom (around $550) during the second half of
the year. A breach of the June-2006 low would pave the way for a test
of long-term support in the low-$500s, a support area we wouldn't
expect to see violated under this or any other realistic scenario.
The second scenario
worthy of consideration is that the post-May-2006 correction ended in
October and the next multi-year advance is already underway. In this
case we'd expect a test of the May-2006 peak within the next few
months; followed by a pullback to around the current level (630-650);
followed by a rally that ultimately takes the gold price well beyond
its May-2006 peak.
The second scenario has the advantage of being consistent with
long-term charts of the gold stock indices. Unlike the US$ gold price,
which is yet to experience its first major correction, the gold stock
indices consolidated for about 20 months beginning in December of 2003.
This consolidation contained two peak-to-trough declines of around 40%
and can reasonably be given the "cyclical bear market" label (in this
case the term "cyclical bear market" means a 1-2 year bearish trend
within a secular bullish trend). It would be unusual for a new cyclical
bear market to begin less than a year after the previous one ended,
meaning that the post-May-2006 downturn in the gold sector is more
likely to be a correction within an on-going cyclical bull market than
the start of a new cyclical bear market; and if this is the right
interpretation then it is not reasonable to expect gold bullion to
trade anywhere near its June-2006 low over the coming 12 months.
The key, we think, is what happens to yield and credit spreads. If
yield and credit spreads become significantly wider during the first
half of the year -- something that probably won't happen unless there's
a large enough decline in confidence to prompt a substantial (10-20%)
downturn in global stock markets -- it will mean that the
financial/economic backdrop is becoming more conducive to a major
advance in the gold price (our second scenario). On the other hand, if
yield and credit spreads remain near their current low levels over the
coming 6 months then any up-move in gold will probably be capped at the
May-2006 peak and there will be a significant risk of a break below the
June-2006 bottom during the second half of this year (our first
scenario).
Just to be clear, we think the more bullish (for gold) intermediate-term scenario would go something like this:
1) Stock markets begin to weaken and interest rate spreads (the
differences between long-term and short-term interest rates and the
differences between the yields on low and high quality debt securities)
begin to widen.
2) The gold price initially declines along with the prices of cyclical
assets such as stock markets and industrial commodities, but holds up
better than these other assets.
3) The markets begin to anticipate the traditional central bank
response to declines in cyclical asset prices and evidence of slowing
growth: looser monetary policy. This results in greater investment
demand for gold and a rise in the gold price in terms of almost
everything.
At this stage we favour the second (more bullish) scenario because it
is consistent with our stock market and economic outlooks. We've
therefore upgraded our intermediate-term outlooks for gold and gold
stocks to "bullish", thus putting ourselves in the uncomfortable
position of being intermediate-term bullish on gold and the US$ at the
same time. The position is uncomfortable from an inter-market
relationship perspective because gold and the Dollar Index usually
trend in opposite directions and the inverse correlation has been
particularly strong over the past 12 months. Note, though, that it's
not an uncomfortable position from a fundamental perspective because
gold's fundamentals are clearly superior to those of the dollar whereas
the dollar's fundamentals are arguably superior to those of the euro.
The decision to upgrade our intermediate-term view on the US$ gold
price was also influenced by gold's recent price action in terms of
currencies other than the US$. Specifically, the long-term charts
included below of gold in A$ terms, gold in terms of the British Pound
and gold in terms of the South African Rand reveal a pattern that can
be described as: a multi-year consolidation ending in 2005; followed by
an almost straight-up surge culminating around the middle of last year;
followed by what currently appears to be a smaller-degree
consolidation. Charts of gold in euro, Yen and Swiss Franc terms have a
similar look and in every case the consolidation that began in mid-2006
appears to be either breaking-out to the upside or about to breakout to
the upside.
As with the gold stock indices, in non-US$ terms gold completed a
lengthy mid-cycle correction within the past 18 months and is therefore
unlikely to embark on another correction of this magnitude in the near
future.
The last thing we'll
mention before leaving our 2007 gold forecast is the potential for the
IMF to adopt an accounting change that requires central banks to
exclude, when reporting their gold reserves, the gold that has been
swapped or loaned out. If implemented this accounting change will
reveal the quantity of the metal that has been swapped/loaned into the
market by the central banking community. Refer to http://www.resourceinvestor.com/pebble.asp?relid=28416 for additional info.
The aforementioned accounting change is a wildcard in that: a) only
senior central-bank insiders currently know the real numbers with
regard to gold loans/swaps, b) it is not certain that the change will
ever actually be implemented, and c) if the change is made official
there's no telling when it will come into effect.
With so many unknowns surrounding this issue it should not form the
basis of any forecast or investment decision. Our guess, though, is
that it won't prove to be a major event in the gold market because it
will only get implemented if the amount of gold involved is either
lower than or roughly in line with mainstream views (no more than a few
thousand tonnes). Putting it another way, it's very unlikely that the
IMF will require central banks to implement an accounting change that
causes great embarrassment to the central banking community. In any
case, even if this mooted accounting change is destined to eventually
become important it won't become important this year because such
things generally get implemented with glacier-like speed.
 The US Stock Market The US Stock Market
As far as the US stock market and most other stock markets are
concerned, the current monetary situation is probably close to being as
good as it gets. To be specific: credit spreads are near all-time lows,
indicating that even poor-quality borrowers can obtain credit at low
rates of interest; yield curves are flat or inverted, which is
indicative of a strong desire to borrow short-term in order to
speculate in longer-term assets/debt; the global supply of currency is
expanding at a rapid rate; and bond yields remain near 20-year lows
despite the obvious evidence of inflation. It's impossible to predict
exactly when this utopian situation will end, but in our opinion
there's little chance of it persisting throughout 2007.
We expect to see a reversal in the liquidity trend -- from expanding to
contracting -- during the first half of 2007; a reversal signaled,
first and foremost, by the widening of credit and yield spreads.
In addition to a very supportive monetary backdrop, the US stock market
has received great assistance over the past few years from rising
profit margins. As discussed by John Hussman in his 22nd January
and earlier commentaries, the primary driver of the rise in US
corporate profit margins to extreme highs has been stagnating labour
costs. Profit margins are mean reverting, however, and the way they
will most likely revert to the mean is via labour taking a larger slice
of the pie.
There's no guarantee that the mean reversion of profit margins will
occur during 2007, but it represents a substantial risk given that a)
the rate of increase in labour costs has already begun to accelerate,
and b) house price gains aren't likely to provide as much of a
psychological offset this year as they have in years gone by to the
absence of real gains on the wage front.
Further to the above, we expect that contracting liquidity and falling
profit margins will weigh the US stock market down over the coming 12
months.
But what about the potential for Fed-sponsored inflation (money-supply
growth) to keep the liquidity expansion going and propel the stock
market upward in the face of deteriorating fundamentals?
We don't think this as a major threat to our overall outlook for 2007,
but before we explain why it's worth quickly reviewing the way
money-supply growth operates.
Incredibly, some people
believe that the central bank can create prosperity by simply expanding
the supply of money. This is despite the US stock market's worst
performance over the past 5 decades having occurred during the decade
with the highest money-supply growth (the 1970s); and despite the
highest rate of year-over-year money-supply growth of the past 20 years
(December-2001) being followed by a 12-month period during which the US
economy was in recession* and the S&P500 Index fell by more than
20%.
If a central bank could create prosperity by expanding the money supply
then no country would ever be poor and Zimbabwe would have the world's
strongest economy, but the reality is that money-supply growth can only
have the effect of reducing the purchasing power of the money. The main
issue from a longer-term perspective, though, stems from the fact that
this loss of purchasing power occurs in a non-uniform -- and often
deceptive -- way. As a result: price signals become inaccurate;
investment is misdirected; productivity growth slows; there is an
eventual net reduction in real wealth; and the asset rich benefit at
the expense of savers, salaried workers, anyone on a fixed income, and
the asset poor. Needless to say (but we'll say it anyway because it's
such a widely misunderstood concept), the capital gains that stem from
inflation have absolutely nothing to do with capitalism.
It is certainly possible for rapid expansion of the money supply to
lead to gains in the stock market because company shares usually
represent claims on real assets and because profits will tend to be
boosted until the point is reached where the effects of inflation have
rippled through the economy (that is, until the point is reached where
labour is grabbing an ever-increasing slice of the pie and the debt
markets are factoring-in rapid future currency depreciation). This
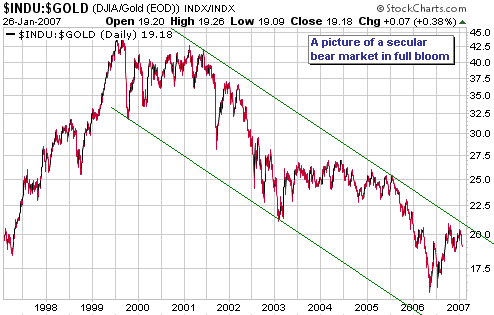
describes what happened over the past 6 years in that over this period
there was sufficient inflation to push the Dow Industrials Index to new
all-time highs in terms of greatly depreciated dollars. In real terms,
however, the Dow's performance was poor. This real performance is
reflected in the following chart of the Dow/gold ratio.
If the total supply
of US dollars grows at a quick pace during 2007 then the US stock
market will probably have an 'up' year in nominal dollar terms IF
there's only a modest increase in labour compensation and IF the bond
market fails to react in a meaningful way to the on-going currency
depreciation. These are, however, big 'ifs' because with bond yields so
low the bond market is acutely vulnerable to a significant rise in
inflation expectations and, as mentioned above, it looks like labour
compensation is about to begin increasing at a faster rate.
In any case, if inflation (money supply growth) proves to be the main
driver of stock market gains during 2007 then our gold stocks should
still do OK and the best-performing sector -- one in which we also have
significant exposure -- would probably be base metals. Therefore,
although it would make our intermediate-term stock market outlook wrong
we don't view the possibility of inflation-related stock market gains
as a risk to our overall position.
In conclusion, then, we are expecting 2007 to be a 'down year' for the
US stock market due to a combination of contracting liquidity and
falling profit margins, but are effectively hedged against the
possibility of liquidity remaining abundant by virtue of our core
long-term position in the industrial metals sector.
*According to the
NBER (the institution that determines the official start and end dates
for US recessions), the recession ended in November of 2001. However,
it didn't actually end until at least the middle of 2003. Discrepancies
between official and actual often occur due to the gross misreporting
of the effects of inflation.

|

